
From “Nice-to-Have” to “Mission Critical”: The ROI of Systemic Organisational Resilience
- Executive Summary: The Wellbeing Miscalculation
- The Hard Data: Why Individual Perks Fail
- Network Theory: Redundancy vs. Fragility
- The Nordic Context: From Individual Sisu to Network Sisu
- The Solution: Engineering Network Sisu with ONA
- The CFO Perspective: Resilience as a Balance-Sheet Asset
- Strategic Checkpoint: The Resilience Audit
- Conclusion: Resilience Is a Balance-Sheet Asset
- References
1. Executive Summary: The Wellbeing Miscalculation
When macroeconomic pressure intensifies and margins contract, the institutional reflex is predictable: Chief Financial Officers audit the corporate ledger for expenditures that can be reclassified from “operational” to “discretionary.” Historically, budgets allocated to corporate culture, employee wellbeing, and relational infrastructure are among the first to be categorised as non-essential and reduced or eliminated.
This reflex is grounded in a specific—and demonstrably incorrect—assumption: that organisational resilience is an individual psychological trait, a personal capacity for stress management that can be maintained through wellness app subscriptions, fitness subsidies, or annual mindfulness seminars. Under this model, if employees are burning out, the intervention is to help them cope better individually. The architecture of the system that produces the burnout is not examined.
The data decisively contradicts this model.
Figure 1: Individual vs. Systemic Interventions — Performance Comparison
| Intervention Type | Measurable Impact on Performance/Retention | ROI per $1 Invested | Source |
|---|---|---|---|
| Individual wellbeing programmes (apps, fitness subsidies, psychology platforms) | 68% fail to produce measurable improvement | Negligible to negative | Gartner |
| Systemic network interventions (support redesign, relational infrastructure) | Documented improvement in retention, performance, recovery speed | $4–$5 return | PwC / WHO |
The contrast is not marginal. It is categorical. Individual interventions fail at a rate of 68% because they address a symptom while leaving the structural cause intact. Systemic interventions succeed because they address the architecture of the network itself.
In 2026, resilience is not a personality trait. It is a mathematical property of the network—a function of connection density, support distribution, redundancy pathways, and the absence of critical single points of failure. When leaders cut the infrastructure of connection, they do not reduce a “nice-to-have” expense. They expose the organisation to catastrophic operational fragility.
This article examines the structural reasons individual wellness perks fail, the hard financial ROI of systemic resilience, the Nordic cultural dimension of Sisu and its limitations, and how Organisational Network Analysis (ONA) provides the engineering framework to transition from individual grit to Network Sisu—collective resilience carried by the architecture, not by isolated individuals.
2. The Hard Data: Why Individual Perks Fail
The corporate wellness industry has grown substantially over the past decade, driven by genuine concern for employee wellbeing and by the attractive simplicity of its value proposition: provide individuals with tools for stress management, and organisational resilience will follow. The premise is intuitive. The evidence does not support it.
2.1 The 68% Failure Rate
Gartner’s HR Research division has documented what many practitioners have long suspected: 68% of individual wellbeing programmes fail to produce any measurable improvement in employee performance, retention, or absenteeism reduction. The programmes are adopted, utilised to varying degrees, and ultimately produce no detectable change in the organisational outcomes they were designed to influence.
The explanation is structural, not motivational. Individual wellness tools operate on the assumption that burnout originates in the individual’s inability to manage stress. In reality, burnout in most organisations originates in flawed network design: imbalanced workload distribution, invisible support concentration, Structural Holes that isolate individuals from the relational resources they need, and the chronic over-reliance on a small number of high-centrality nodes to sustain organisational function.
Consider a concrete scenario: an employee receives 50 urgent cross-functional requests per day because they are the sole bridge between two departmental silos—a structural bottleneck produced by the network’s architecture, not by the individual’s work habits. Providing this employee with a meditation app subscription does not reduce the 50 daily requests. It asks them to breathe more calmly while absorbing an unsustainable structural load. The intervention does not match the diagnosis.
2.2 The Systemic ROI: $4–$5 per Dollar Invested
The financial case for systemic intervention is, by contrast, robust. A joint study by PwC and the World Health Organization has established that systemic organisational resilience interventions yield a return of $4 to $5 for every $1 invested. Furthermore, organisations with high systemic resilience recover operational revenue approximately twice as fast following market shocks, restructurings, or other disruptive events.
Figure 2: The Resilience ROI Framework
| Investment Category | Example Interventions | Failure Rate | ROI | Recovery Speed Post-Disruption |
|---|---|---|---|---|
| Individual Perks | Wellness apps, fitness subsidies, EAP, mindfulness seminars | 68% | Negligible | No measurable improvement |
| Systemic Network Infrastructure | ONA diagnostics, support redistribution, Tokenized Recognition, network redundancy engineering | Documented efficacy | $4–$5 per $1 | 2x faster revenue recovery |
The differential is not a matter of degree. It is a matter of category. Individual interventions and systemic interventions are addressing fundamentally different problems. One treats the individual’s coping capacity. The other repairs the architecture that determines how much coping is required.
Resilience, measured this way, is not a charitable expenditure. It is a margin-protection strategy with a documented, auditable financial return.
2.3 The Compounding Cost of Fragility
The inverse case—the cost of failing to invest in systemic resilience—is equally instructive. Organisational fragility does not produce a single, visible failure event. It produces a compounding erosion of capacity that manifests across multiple dimensions simultaneously:
Figure 3: The Fragility Cost Cascade
| Stage | Mechanism | Operational Consequence |
|---|---|---|
| 1. Network concentration | Critical knowledge and support functions concentrate in a small number of high-centrality individuals | Operational dependency on unmonitored, unprotected nodes |
| 2. Invisible overload | These individuals absorb disproportionate relational and cognitive load without formal recognition | Progressive Allostatic Load accumulation; declining cognitive flexibility |
| 3. Burnout or departure | Overloaded nodes reach capacity limits; some exit, some withdraw into minimum viable performance | Sudden loss of institutional knowledge; Structural Holes open |
| 4. Cascade failure | Teams and functions that depended on departed nodes lose access to support, knowledge, and connective pathways | Cross-functional collaboration collapses; remaining employees absorb redistributed load |
| 5. Systemic fragility | The network, now thinner and more concentrated, becomes even more dependent on fewer remaining nodes | Cycle accelerates; each subsequent departure produces larger cascading effects |
This is not a theoretical model. It is the documented pattern of organisational decline in enterprises that treat resilience as an individual responsibility rather than a network property. Each stage is preventable—but only if the network’s structural health is visible and actively managed.
3. Network Theory: Redundancy vs. Fragility
To understand why systemic investment outperforms individual intervention by such a margin, it is necessary to examine organisational culture through the lens of Network Architecture—the structural properties that determine whether a system can absorb disruption or whether it fractures under stress.
3.1 Single Points of Failure
In engineering and network theory, a Single Point of Failure (SPOF) is any component whose failure causes the entire system—or a significant portion of it—to cease functioning. In IT infrastructure, eliminating SPOFs is a foundational design principle. No competent systems architect would deploy a production environment in which a single server failure could bring down the entire network.
Yet in organisational design, precisely this architecture is not only tolerated—it is normalised. In most enterprises, a small number of individuals carry a disproportionate share of the organisation’s informal operational load: institutional knowledge, cross-functional connectivity, emotional support, mentoring, and problem-solving capacity. These individuals are the human equivalent of a single-server architecture. They are the organisation’s SPOFs.
Figure 4: SPOF Concentration — Typical Hybrid Organisation
| Network Property | Healthy Distribution | Typical SPOF Pattern | Risk Level |
|---|---|---|---|
| Institutional knowledge holders | Distributed across 15-20% of workforce | Concentrated in 3-5% of workforce | Critical |
| Cross-functional bridge individuals | Multiple overlapping bridges per silo boundary | 1-2 individuals per silo boundary | Critical |
| Informal emotional support providers | Distributed network of peer support | 5-8 individuals absorbing majority of support demand | High |
| Decision-making bottlenecks (informal) | Decisions distributed through empowered teams | 2-3 individuals consulted on majority of cross-functional decisions | High |
When these individuals depart—or, more commonly, reach burnout thresholds and withdraw into minimum viable performance—the consequences are not proportional to their individual role. They are systemic, because the network pathways they maintained collapse simultaneously.
3.2 Engineered Redundancy
A resilient network is characterised by the opposite architectural property: Network Redundancy. This means that critical functions—knowledge transfer, cross-functional connectivity, emotional support, problem-solving capacity—are served by multiple overlapping pathways rather than concentrated in a small number of critical nodes.
In a redundant network, the departure or temporary incapacity of any single node is absorbed by the surrounding architecture. Support is redistributed naturally. Knowledge remains accessible through alternative pathways. Cross-functional connectivity is maintained through parallel bridges. The system degrades gracefully rather than catastrophically.
Figure 5: Fragile vs. Resilient Network Architecture
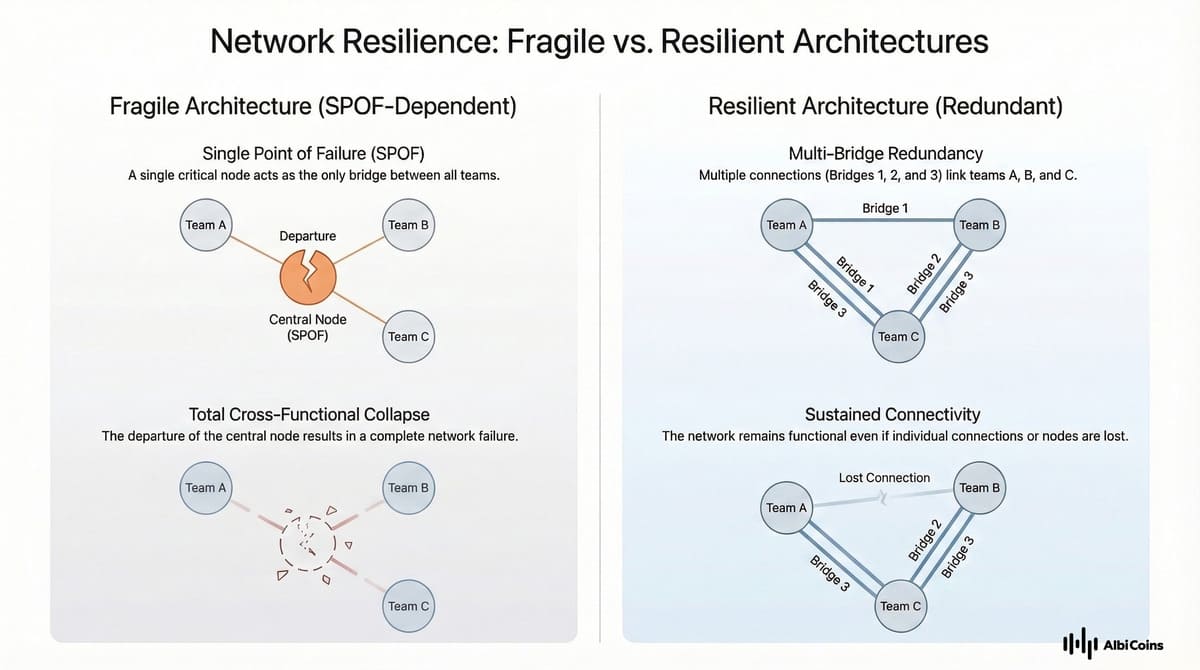
Multiple overlapping bridges. Any single node departure = graceful redistribution, no collapse.
The transition from fragile to resilient architecture is not organic. In a hybrid environment where Weak Ties decay naturally and physical proximity no longer generates redundant pathways passively, redundancy must be deliberately engineered. This is the core operational case for systemic resilience investment.
3.3 Quantifying Network Resilience
Network resilience can be assessed through several measurable properties:
Figure 6: Network Resilience Scorecard
| Resilience Metric | Fragile State | Resilient State | Measurement Method |
|---|---|---|---|
| SPOF Concentration | >30% of cross-functional traffic flows through <5% of nodes | Cross-functional traffic distributed across >15% of nodes | ONA — centrality analysis |
| Redundancy Ratio | <1.5 pathways per critical function | >3.0 pathways per critical function | ONA — pathway mapping |
| Weak Tie Density | <2 cross-silo connections per employee (avg.) | >5 cross-silo connections per employee (avg.) | ONA — Gratitude Density Map |
| Support Distribution | Top 5% of nodes receive >40% of support requests | Top 5% of nodes receive <20% of support requests | ONA — inbound recognition analysis |
| Recovery Speed (post-disruption) | >6 months to restore cross-functional flow after key departure | <6 weeks to restore equivalent flow | ONA — longitudinal tracking |
These metrics are not aspirational abstractions. They are measurable, trackable, and directly correlated with the financial outcomes documented in Section 2. An organisation that scores in the “Fragile” column across multiple dimensions is carrying an unquantified structural liability. An organisation that systematically moves toward the “Resilient” column is building a balance-sheet asset.
4. The Nordic Context: From Individual Sisu to Network Sisu
In Finland and across the Nordic region, the discussion of resilience carries a specific cultural weight, because it intersects with one of the most deeply held concepts in Finnish national identity: Sisu.
4.1 The Mythology of Individual Grit
Sisu—loosely translated as extraordinary perseverance, stoic determination, and the capacity to endure beyond what seems possible—is a core element of Finnish self-understanding and, by extension, of Finnish management philosophy. For decades, Nordic enterprises have implicitly relied on the individual Sisu of their employees to navigate economic downturns, organisational restructurings, and competitive pressures. The cultural expectation was clear: endure, adapt, push through.
In an era of discrete, bounded challenges—a single recession, a specific restructuring, a defined competitive threat—individual Sisu was often sufficient. The challenge arrived, the individual endured, recovery followed.
4.2 The Breaking Point of Individual Sisu
In an era of polycrisis—overlapping, compounding disruptions without clear resolution horizons—individual Sisu has reached its structural limit. The data from Nordic occupational health authorities confirms this:
Figure 7: The Sisu Breaking Point — Nordic Exhaustion Data
| Indicator | Data | Source |
|---|---|---|
| #1 cause of long-term sick leave in Finland | Mental exhaustion / burnout | Finnish Institute of Occupational Health (TTL) |
| #1 cause of long-term sick leave in Sweden | Mental exhaustion / burnout | Försäkringskassan |
| Annual cost to Nordic economies | Billions of euros (aggregate) | TTL / Försäkringskassan combined reporting |
| Finnish workers with chronic Recovery Debt (Palautumisvelka) | >40% | TTL |
| Trend direction (5-year) | Increasing | TTL / Försäkringskassan |
Individual Sisu has not weakened. The demands placed upon it have exceeded what any individual psychological resource can sustain. When the challenges are continuous, compounding, and without clear endpoints, the “grit your teeth and push through” model does not produce resilience. It produces a workforce operating in chronic Allostatic overload—physically present, technically functional, but progressively depleted of the cognitive and emotional resources that drive innovation, adaptation, and collaborative performance.
4.3 Network Sisu: The Architectural Alternative
The transition required is conceptual and structural: from individual Sisu (resilience carried by the person) to Network Sisu (resilience carried by the architecture).
Network Sisu means that the burden of endurance is not concentrated in the individual’s psychological resources. It is distributed across a redundant, visible, actively maintained network of mutual support. When one node is under strain, the surrounding architecture absorbs the load—not because individuals are heroically stepping in, but because the system is designed to redistribute pressure through multiple overlapping pathways.
Figure 8: Individual Sisu vs. Network Sisu — Operating Model Comparison
| Dimension | Individual Sisu | Network Sisu |
|---|---|---|
| Resilience carrier | The individual employee | The network architecture |
| Failure mode | Individual burnout → cascading team impact | Graceful degradation → distributed load absorption |
| Visibility of strain | Personal rest, leave, EAP | Network redistribution, peer support pathways, Tokenized Recognition |
| Scalability | Does not scale; each crisis depletes individuals further | Scales with network density; each reinforced connection adds capacity |
| Cultural compatibility (Nordic) | Deep cultural resonance but finite capacity | Extends Sisu from personal virtue to collective infrastructure |
| Measurability | Difficult (self-report, lagging) | Precise (ONA, real-time, structural) |
Network Sisu does not replace the Finnish cultural value. It extends it—from a personal virtue into a collective infrastructure. The individual’s capacity to endure remains valued. But it is no longer the only load-bearing element. The network carries the weight together.
5. The Solution: Engineering Network Sisu with ONA
Transitioning from individual to network resilience is not an aspirational cultural shift. It is an engineering project with specific diagnostic requirements, intervention mechanisms, and measurable outcomes.
5.1 Identifying Fragility with ONA
The first step is diagnostic: make the invisible visible. AlbiMarketing’s Organisational Network Analysis maps the structural resilience of the organisation in real time, producing a diagnostic that answers the questions traditional instruments cannot:
- Where are the Single Points of Failure? Which individuals carry disproportionate network load—institutional knowledge, cross-functional connectivity, informal support—and are therefore the nodes whose failure would produce cascading consequences?
- What is the Redundancy Ratio? For each critical organisational function, how many overlapping pathways exist? Where is the architecture robust, and where is a single departure sufficient to sever a critical connection?
- Where are the Structural Holes? Which teams, functions, or geographies lack mutual support pathways? Where has the network thinned to the point that disruption cannot be absorbed?
- What is the current state of Support Distribution? Is the relational and emotional labour of the organisation equitably distributed, or is it concentrated in a small number of unprotected nodes?
ONA transforms these questions from philosophical concerns into measurable, actionable data. Leadership moves from “we think our people are resilient” to “we can see, in real time, where our network is structurally fragile and what specific interventions are required.”
5.2 Building Redundancy with AlbiCoins
Once the diagnostic reveals the network’s fragility patterns, the intervention mechanism must generate new connective pathways—deliberately, continuously, and at scale.
AlbiCoins provide this mechanism. Each peer-to-peer recognition transaction is simultaneously an act of appreciation and a structural reinforcement event. When a colleague sends an AlbiCoin, they are:
Forging a new connection or reinforcing an existing one in the network’s architecture. Creating a cross-functional data point that feeds into the ONA diagnostic, making the evolving state of the network visible. Redistributing Social Capital from concentrated nodes toward the broader network, reducing SPOF concentration. And providing tangible recognition—redeemable through the Albi Store—that sustains the motivation to maintain supportive behaviour over time.
Over weeks and months, the cumulative effect of daily Tokenized Recognition transforms the network’s architecture. Fragile, concentrated topologies evolve into redundant, distributed, resilient ecosystems—not through top-down restructuring, but through the organic accumulation of peer-initiated relational investment, guided by ONA diagnostics.
Figure 9: The Network Sisu Engineering Cycle
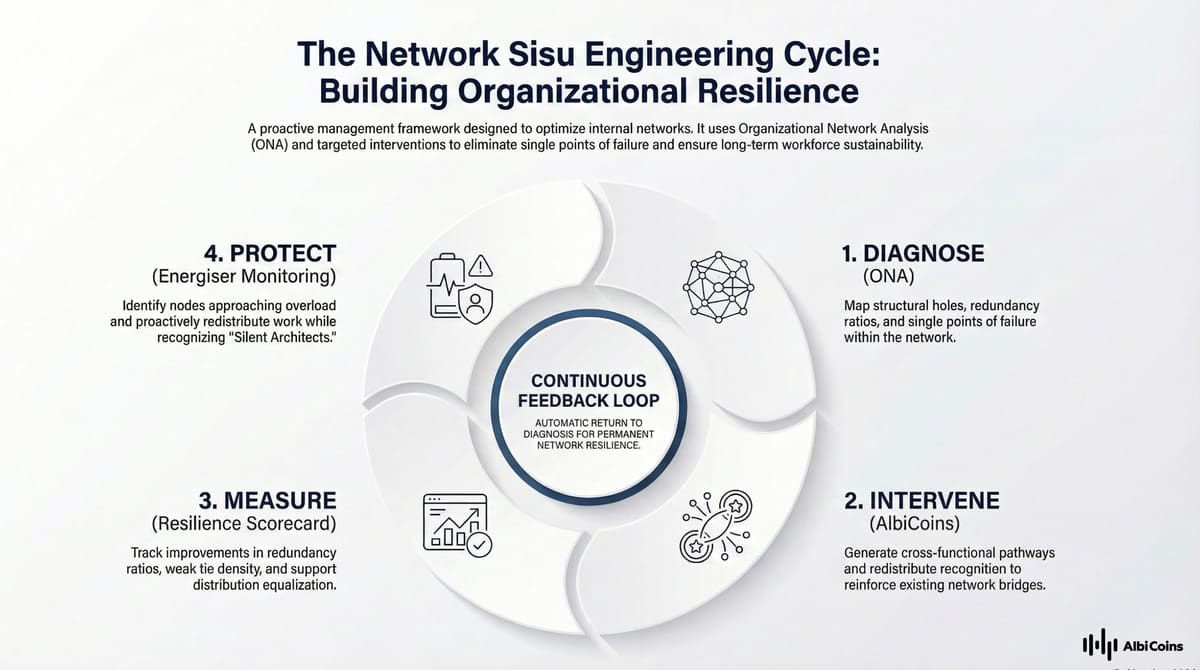
This is Network Sisu in practice: a continuous, data-driven cycle of diagnosis, reinforcement, measurement, and protection that builds collective resilience as an organisational asset rather than consuming individual resilience as a disposable resource.
6. The CFO Perspective: Resilience as a Balance-Sheet Asset
For Chief Financial Officers evaluating resilience investment, the framework is straightforward when stated in financial terms:
Figure 10: The CFO Decision Matrix — Wellness Perks vs. Network Infrastructure
| Decision Criterion | Individual Wellness Perks | Systemic Network Infrastructure |
|---|---|---|
| Documented failure rate | 68% (Gartner) | Documented efficacy (PwC/WHO) |
| ROI per $1 invested | Negligible to unmeasurable | $4–$5 (PwC/WHO) |
| Revenue recovery speed post-disruption | No measurable improvement | 2x faster |
| Addresses root cause of burnout? | No (individual coping) | Yes (network architecture) |
| Measurable in real-time? | Limited (utilisation metrics) | Yes (ONA, Gratitude Density) |
| Protects against SPOF cascade? | No | Yes |
| Scalable across enterprise? | Linear cost scaling, diminishing returns | Network effects (value increases with adoption) |
| Classification | Discretionary operating expense | Mission-critical infrastructure investment |
The reclassification is clear: systemic resilience infrastructure is not a discretionary wellbeing expense. It is a capital-efficient, margin-protecting, operationally critical investment with a documented return that exceeds most categories of corporate expenditure.
7. Strategic Checkpoint: The Resilience Audit
Before approving the next budget cycle, the CFO and CEO must align on three diagnostic questions:
- Are we funding apps or architecture? Is the organisation’s resilience budget allocated to individual wellness perks with a documented 68% failure rate, or to systemic network infrastructure with a documented $4–$5 ROI? If the former dominates, the budget is structurally misallocated.
- Where are our Single Points of Failure? Can leadership identify, with empirical precision, the individuals whose departure or burnout would produce cascading operational consequences? If the most overloaded, most critical informal leaders in the organisation cannot be named from data, the organisation is carrying an unquantified structural liability.
- Are we relying on outdated Sisu? Is the organisation’s implicit resilience model still premised on the expectation that individuals will absorb disruption through personal psychological resources? Or has leadership provided the structural network of mutual support—visible, measured, actively maintained—that distributes the burden of resilience across the collective?
8. Conclusion: Resilience Is a Balance-Sheet Asset
Organisational resilience is not a “nice-to-have” HR initiative. It is not a cultural aspiration. It is not a personal psychological trait that can be outsourced to a wellness app.
Resilience is a measurable structural property of the network—a function of connection density, redundancy, support distribution, and the deliberate engineering of collective capacity to absorb and adapt to disruption. It can be quantified. It can be audited. It delivers a documented financial return.
The organisations that will navigate the next decade of compounding disruption are not those with the most individually resilient employees. They are those that have built the network architecture to carry the weight collectively—transitioning from individual Sisu to Network Sisu, from fragile concentration to engineered redundancy, from “nice-to-have” to mission-critical.
The meditation app is optional. The network infrastructure is not.
Audit your network resilience with AlbiMarketing →
References
- PwC / World Health Organization: The Global Economic Burden of Mental Health and the ROI of Systemic Interventions — data on the $4–$5 ROI of systemic resilience investment
- Gartner: HR Practice: Rethinking Employee Wellbeing — data on the 68% failure rate of individual wellbeing programmes
- Finnish Institute of Occupational Health (TTL) & Försäkringskassan: Sickness Absence Statistics — data on mental exhaustion as the #1 cause of long-term sick leave in Finland and Sweden
- Harvard Business Review: The Network Secrets of Great Change Agents
- Burt, R.S.: Structural Holes: The Social Structure of Competition, Harvard University Press (1992)
- McEwen, B.S.: Allostasis and Allostatic Load, Neuropsychopharmacology (2000)
- Cross, R., Rebele, R. & Grant, A.: Collaborative Overload, Harvard Business Review (2016)
- Taleb, N.N.: Antifragile: Things That Gain from Disorder, Random House (2012)