

You reorganised six months ago and delivery slowed
- The symptom: the same work, moving more slowly
- The usual explanation, and why it does not hold
- What failed: connectivity inside the organisation
- How to check this in your own organisation
- The structural response
- Conclusion
- References
A redesign redraws the formal lines in an afternoon and resets the informal ones that were carrying the work.
The symptom: the same work, moving more slowly
The new structure was announced in the spring. Reporting lines are cleaner, duplication has been removed on paper, and the rationale still holds up when you read it back. Two quarters on, the same volume of work is taking longer. The delay does not sit inside any task. It sits between them, in the time spent establishing who now decides, who needs to be told, and which of the two people who used to handle this is still responsible for it.
A useful measurement is available to anyone willing to run it. Take a routine piece of work that crosses at least two units, and count the people copied on it from request to completion. Compare that count with the same process a year ago. In organisations where a redesign has gone wrong in this particular way, the number has grown noticeably while the work itself has not changed at all. The extra people are there because nobody is certain which of them is required.
What makes the slowdown hard to argue about is that everyone can see it and nobody can locate it. Each unit reports that its own part is running normally, and each is telling the truth. The lost time accumulates in the spaces between units, where no one is measured, and a general sense of sluggishness is the only form in which it reaches management.
This article looks at connectivity inside an organisation. An earlier piece in this series examined connectivity across the outer boundary, where corporates and external partners fail to find each other. The condition is the same one, and the failure mode here is specific: the connections that were doing the work existed, they were functioning, and a structural change removed them without anyone deciding to.
The usual explanation, and why it does not hold
Two responses are standard at the six-month mark, and both make the situation worse.
The first is patience. People are still settling in, the argument goes, and another quarter will sort it out. Sometimes it does. Where the coordination paths have actually been severed, waiting allows a workaround to harden into the new normal, and the workaround usually involves one or two individuals who happen to know everybody and who are now a dependency for the whole organisation.
The second is another redesign. The structure was almost right, the reasoning goes, and one more adjustment will finish the job. External survey evidence argues strongly against this reflex. McKinsey’s global survey on organisational redesigns, published in 2014, found redesigns to be near-universal and mostly disappointing.
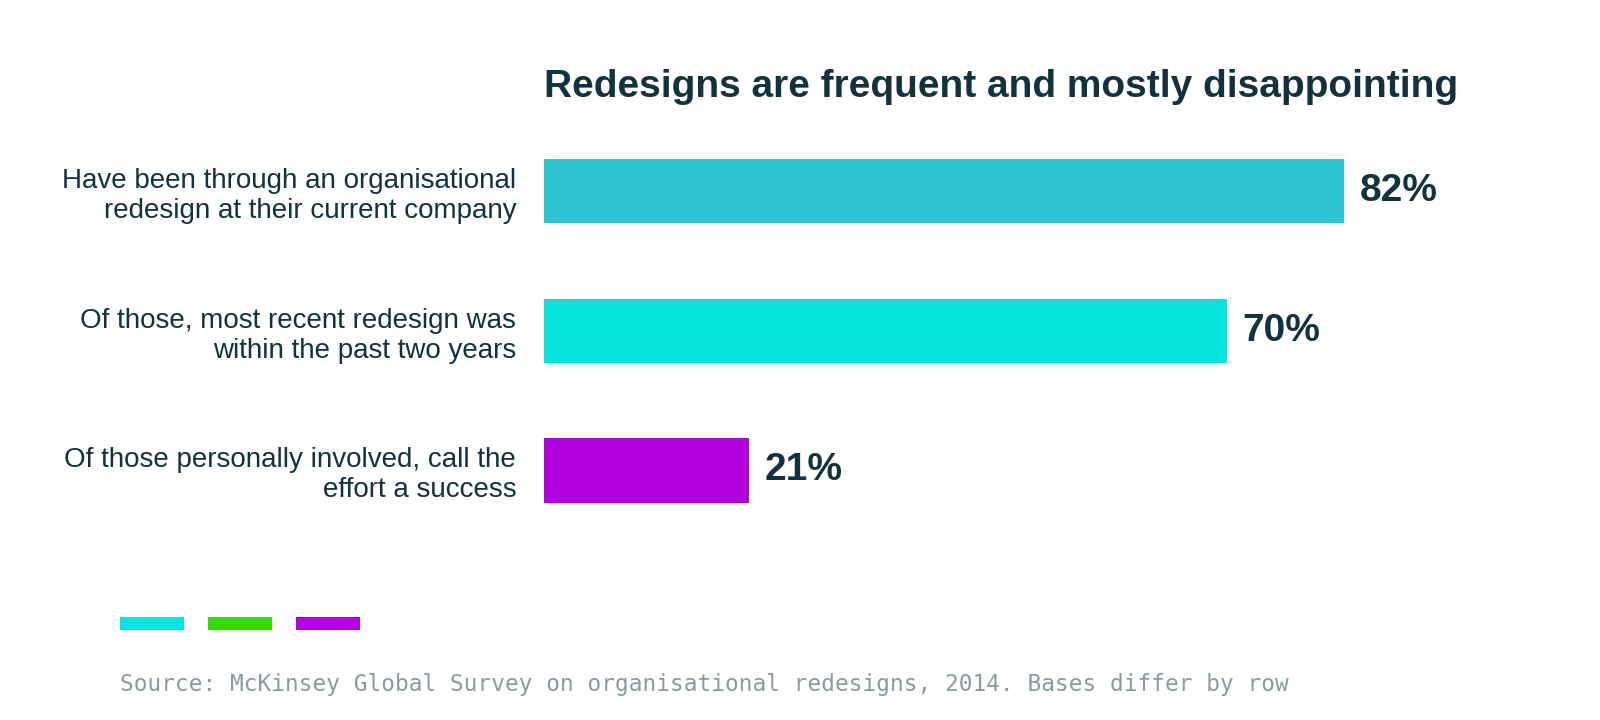
Figure 1. How common redesigns are, and how often they are judged to have worked. Source: McKinsey Global Survey on organisational redesigns, 2014.
The same firm reported in 2015 that fewer than a quarter of redesign efforts succeed, with around 44 per cent losing momentum after starting and about a third failing to meet objectives or improve performance once implemented. Those figures are a decade old, so it is worth noting that more recent work points the same way: their 2025 research on operating model transformations finds most companies meeting the bulk of their objectives while only around a quarter reach a result they describe as highly successful.
Read together, these numbers say something specific about the second reflex. A further redesign repeats an intervention with a low base rate of success, and applies it to an organisation that is currently carrying the cost of the previous one.
What failed: connectivity inside the organisation
Our first study is direct about where innovation and delivery break. Most failures occur at handovers between teams, functions and units. Organisations that handle those handovers well do so through horizontal collaboration, and the report identifies three recurring forms of it.
| Structure | What it does | What it looks like in practice |
|---|---|---|
| Open peer communities | Let people raise issues and articulate early ideas before formal evaluation | Trusted networks, informal guidance, regular community meetings |
| Small autonomous groups | Provide synchronous dialogue where ideas are discussed, reframed and stabilised | Core teams inside professional communities, small face-to-face groups |
| Cross-functional coordination groups | Connect departments when solutions move towards operational adoption | Innovation boards, recurring forums, virtual co-creation sessions |
Table 1. The three horizontal structures our first study found across organisations. Source: Bridgium, How Innovation Happens (2026), section 8.1 and Appendix 3.
Our study records four characteristics these groups share regardless of what an organisation calls them: regular interaction embedded in everyday work, non-hierarchical discussion, shared ownership of emerging ideas, and knowledge exchange across teams. Respondents describe them as ordinary and indispensable at the same time.
“The most promising, the most impactful is network… it’s guidance, it’s talking.”
Innovation Lead · Energy & Utilities · Finland
None of these structures appears on an organisation chart. They have no box, no budget line and usually no name outside the group itself, which means that when the chart is redrawn nobody is assigned to defend them. A redesign that carefully preserves every formal reporting relationship can remove all of them by accident.
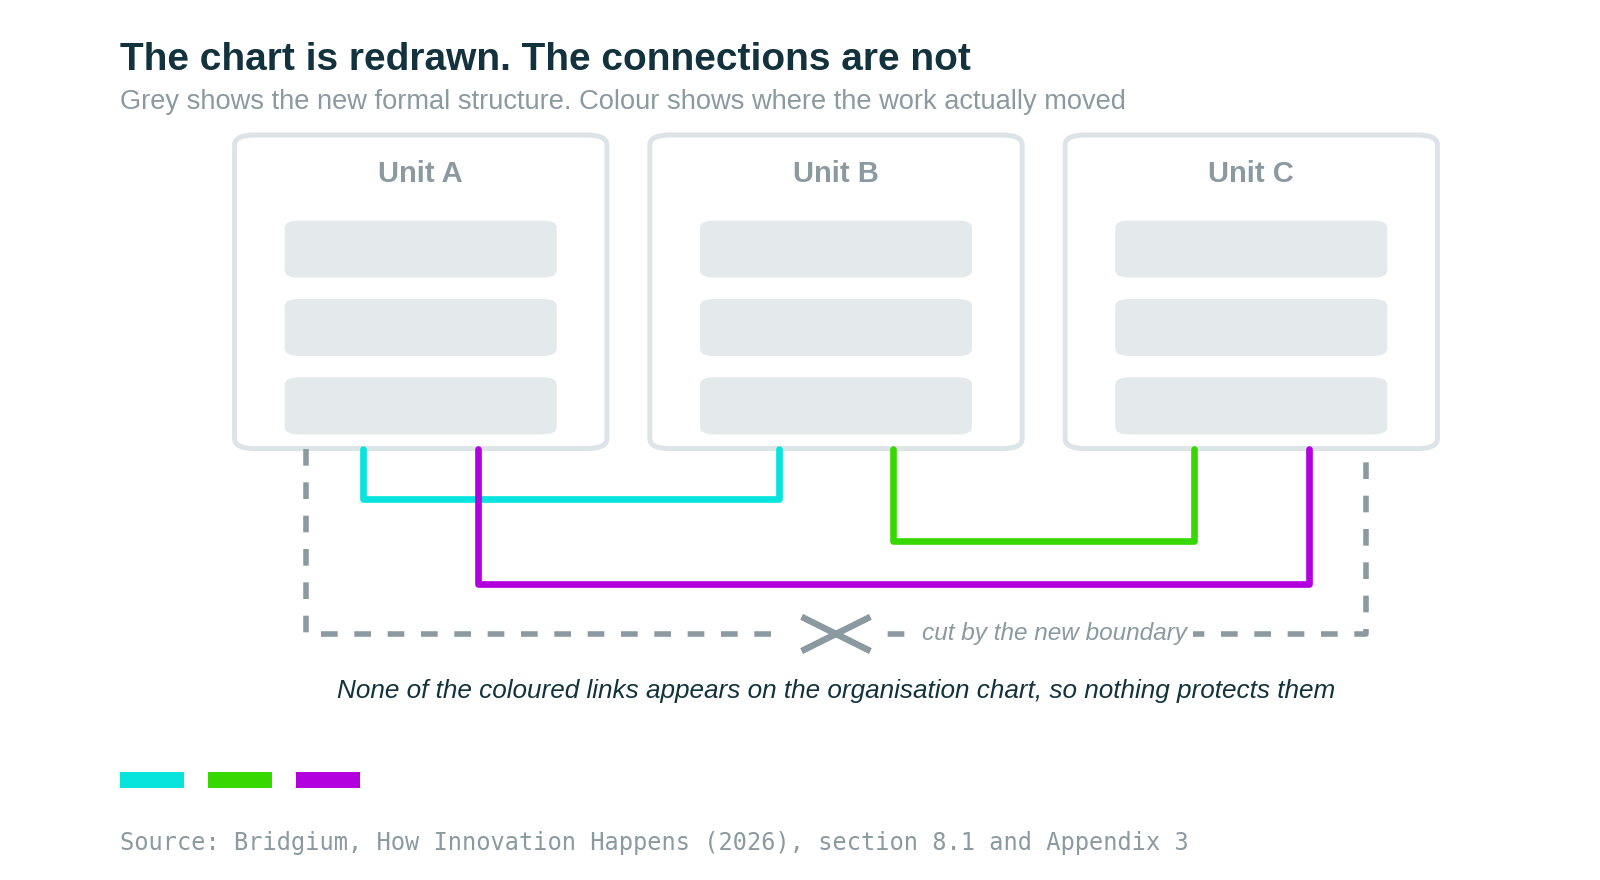
Figure 2. The formal structure and the working connections, drawn together. Source: Bridgium, How Innovation Happens (2026), section 8.1 and Appendix 3.
The mechanics of the loss are mundane. A community met monthly because two of its members sat in the same building and organised it between them; one has moved to another unit and the meeting has no host. A coordination forum existed because a director chaired it, and the directorate no longer exists. A small group had a shared objective that was split across two new units in the redesign, so nobody owns the reason it met. In each case the people are still employed and still willing. The occasion has gone.
There is a second-order effect worth naming. Once the structures are gone, coordination reverts to whoever happens to know people across the new boundaries, usually a handful of long-serving colleagues. The organisation functions, which is why the problem stays invisible, and it now has several single points of failure that appear on no risk register. When one of them changes role, a set of processes stops working for reasons nobody can explain.
The academic reading
Karl Weick’s work on sensemaking explains the immediate slowdown. People act on their reading of a situation, and that reading is assembled socially, from cues and from colleagues. A restructure invalidates a large part of the available cues at once, so the same decision that took one conversation now takes three, and the extra two are spent working out who is entitled to have an opinion.
Mark Granovetter’s account of weak ties identifies which connections matter most here. The links that carry information between groups are usually the occasional ones, maintained by a shared meeting or an old project rather than by daily work. They are also the easiest to lose, because nothing in the calendar depends on them. Ikujiro Nonaka and Hirotaka Takeuchi supply the last piece. Coordination knowledge, meaning the practical understanding of how work actually moves between two units, is tacit and lives in relationships. It does not transfer with a role, and the person inheriting the role receives the responsibility and none of the knowledge.
How to check this in your own organisation
Five questions, and none of them requires a survey.
First: how many people are involved in one routine handover now, compared with a year ago? This is the measurement described at the top of this article, and it is the closest thing to a direct reading of the condition.
Second: which recurring cross-unit meetings stopped happening in the six months after the change, and who used to organise them? Calendar data answers this in an afternoon and almost nobody looks.
Third: when a question crosses two units now, how many attempts does it take to reach the person who can answer it? Ask three people who do this weekly rather than estimating.
Fourth: who are the individuals everybody is currently routing things through? A short list of names is a sign that the organisation has replaced its structures with a handful of people, and that arrangement has a single point of failure attached to each name.
Fifth: before the redesign, was any inventory taken of the informal coordination that existed? If the answer is no, which it usually is, then the design was optimised against a picture of the organisation that omitted how the work moved.
| What you observe | What is usually assumed | What to check instead |
|---|---|---|
| Work takes longer, tasks unchanged | People are still adjusting | How many people are copied on one handover now |
| More meetings about the same decisions | Meeting discipline has slipped | Whether the decision right was assigned to anyone |
| Everything routes through two people | They are unusually helpful | Which structures those two replaced |
| Cross-unit forums stopped without a decision | They had run their course | Who used to convene them and where that role went |
| The case for another redesign | The structure was almost right | Which connections the last one removed |
Table 2. Post-redesign symptoms and the checks that separate an adjustment period from a severed connection. Source: Bridgium analysis based on How Innovation Happens (2026), section 8.1.
The Nordic dimension
Nordic organisations are more exposed to this failure than hierarchical ones, and for a reason that is usually counted as a strength. Where hierarchy is low and access is direct, a great deal of coordination runs on informal relationships instead of on formal escalation. Work moves because people ask each other, and that works extremely well until the question of who to ask becomes open.
“Traditional meeting… physically present… completely different type of communication than sitting behind the screen.”
Senior R&D Manager · Materials & Process Industry · Finland
The consequence is arithmetic. The more of an organisation’s coordination sits outside the chart, the more of it a chart-based redesign will destroy without registering the loss. A hierarchical company that reorganises damages its formal paths and keeps most of its informal ones, because they were never carrying much. A flat company doing the same thing loses the part that was doing the work.
The compensating advantage is that repair is fast here. Restoring a forum requires someone to name a host and put a recurring slot in a calendar, and in a low-hierarchy organisation that person does not need permission. The constraint is attention rather than authority, which means the repair will happen if it is on somebody’s list and will not happen otherwise.
The structural response
Four steps. The first belongs before a redesign and the other three apply at any point afterwards.
- Inventory the horizontal structures before announcing anything. Ask each unit which recurring cross-unit groups its people take part in, who convenes each one and what it is for. This takes a week and produces the map that the redesign is otherwise optimised without. Any group whose members end up split across new boundaries is a known risk rather than a surprise in month four.
- Restore the coordination groups first, ahead of the reporting lines. Reporting relationships re-establish themselves because payroll and objectives depend on them. Communities and forums have no such enforcement, so they need a named convener and a date in the calendar, assigned deliberately in the first month.
- Give every interface between new units an owner. Where work crosses a boundary, one named person on each side should be accountable for the handover working. Our study finds that knowledge crosses unit interfaces reasonably well while responsibility does not, and an unowned interface is where the extra people on the email chain come from.
- Measure handover time and report it alongside delivery. Time from request to acceptance at each internal boundary is measurable, cheap to collect and directly sensitive to this failure. Without it, a connectivity problem presents as a general slowdown, and a general slowdown invites another redesign.
Conclusion
An organisation chart is a description of accountability. The work is carried by a second structure that overlaps the first only partly: forums, communities, small groups and a set of relationships that exist because of history and proximity. A redesign edits the first structure with great care and the second one by accident, and the gap between the two explains most of what happens in the following six months.
The organisations in our study that handle transitions well are not the ones with better charts. They are the ones that know which horizontal structures they have and re-establish them deliberately whenever the formal picture changes. That is an unglamorous discipline and it costs almost nothing compared with a second restructure.
So the question worth asking before the next structural change is short. Which meetings, groups and forums will stop happening because of this, and who is responsible for starting them again?
The findings above come from How Innovation Happens: Insights from Leading Enterprises in Times of Change (2026), a Bridgium study based on 28 interviews with innovation and transformation leaders in Northern Europe. Section 8 covers the cross-cutting conditions and Appendix 3 documents how the horizontal structures are organised in practice. The report is available at bridgium-research.eu/innovation-report-2026
References
- Bridgium, How Innovation Happens: Insights from Leading Enterprises in Times of Change (2026), section 8.1 and Appendix 3.
- Bridgium, From Discovery to Practice: How Corporate–Startup Collaboration Becomes Usable (2026), section 7.
- McKinsey & Company, The secrets of successful organizational redesigns: McKinsey Global Survey results (2014).
- McKinsey & Company, Getting organizational redesign right (2015).
- McKinsey & Company, How to get your operating model transformation back on track (2025).
- Granovetter, M. S. (1973). The Strength of Weak Ties. American Journal of Sociology, 78(6).
- Burt, R. S. (1992). Structural Holes: The Social Structure of Competition. Harvard University Press.
- Weick, K. E. (1995). Sensemaking in Organizations. Sage.
- Nonaka, I. & Takeuchi, H. (1995). The Knowledge-Creating Company. Oxford University Press.
- Cohen, W. M. & Levinthal, D. A. (1990). Absorptive Capacity: A New Perspective on Learning and Innovation. Administrative Science Quarterly, 35(1).
- Berger, P. L. & Luckmann, T. (1966). The Social Construction of Reality. Penguin.
- Knowledge loss and employee turnover, Part I. The Learning Organization, 30(2).